Research note · reanalysis of public data
Reading the Smoldering Edge of a Multiple Sclerosis Lesion — from public data alone
A weekend computational lab: I took only public brain datasets and asked whether the molecular “fingerprint” of the inflamed rim of an MS lesion could be defined and validated — then I tried hard to prove myself wrong.
Start here: what goes wrong in MS
Your nerve fibers are wrapped in myelin, a fatty insulation that lets electrical signals race along them — think of the plastic coating on a wire. In multiple sclerosis (MS), the immune system mistakenly attacks that insulation and strips it away in patches. Where the coating is gone, signals slow down or short out, which is why MS can affect vision, movement, balance, and thinking. Each bare patch is called a lesion.
How an MS lesion starts: immune cells strip the myelin insulation off a nerve fiber, leaving it bare and unable to carry signals cleanly.
Why the edge of a lesion is the interesting part
Not all lesions are equal. Many burn out and go quiet. But the worrying ones are chronic active, or “smoldering,” lesions: the center is already destroyed and inactive, while a thin rim around the edge stays quietly inflamed for years — slowly eating outward into healthy tissue like the glowing edge of a smoldering piece of paper. That creeping rim is now thought to be a major driver of the long-term disability in progressive MS.
Here's the frustrating part: today's best MS drugs mostly deplete B cells, but the rim is run largely by different immune cells — myeloid cells and T cells — so the drugs don't shut it down. Doctors can even spot these lesions on an MRI now as an iron-stained “paramagnetic rim.” The open question is what the rim is doing at the molecular level — and whether we can read that fingerprint from data that has already been collected, without any new patients or experiments.
Anatomy of a smoldering lesion: a burnt-out core, surrounded by a chronically inflamed rim that slowly expands into the normal-appearing white matter around it. This page is about reading that rim molecularly.
The plan: discover, then validate — no new samples
No wet lab, no new sequencing. I used four public human-brain datasets: one single-nucleus RNA-seq atlas to define a rim signature, and independent spatial-transcriptomics datasets to test whether that signature actually lights up at the rim in situ.
The logic is simple: first define a molecular fingerprint of the rim in one dataset, then check whether that same fingerprint shows up in the right place in completely separate datasets. A fingerprint that only works on the data that created it isn't science — it has to survive being tested somewhere new.
The strategy in one picture. “Single-cell” methods read the genes of individual cells; “spatial” methods also keep track of where each reading came from in the tissue — so you can ask not just what is switched on, but where.
Step 1 — a molecular signature of the rim
From the single-nucleus data I contrasted the active lesion edge against non-active MS white matter, cell type by cell type, and characterized the resulting gene program. It came back biologically coherent — antigen presentation (MHC-II), complement, interferon, and inflammatory (TNF/NF-κB) signaling — exactly the machinery you'd expect in smoldering inflammation.

Step 2 — does it localize to the rim? Two spatial platforms
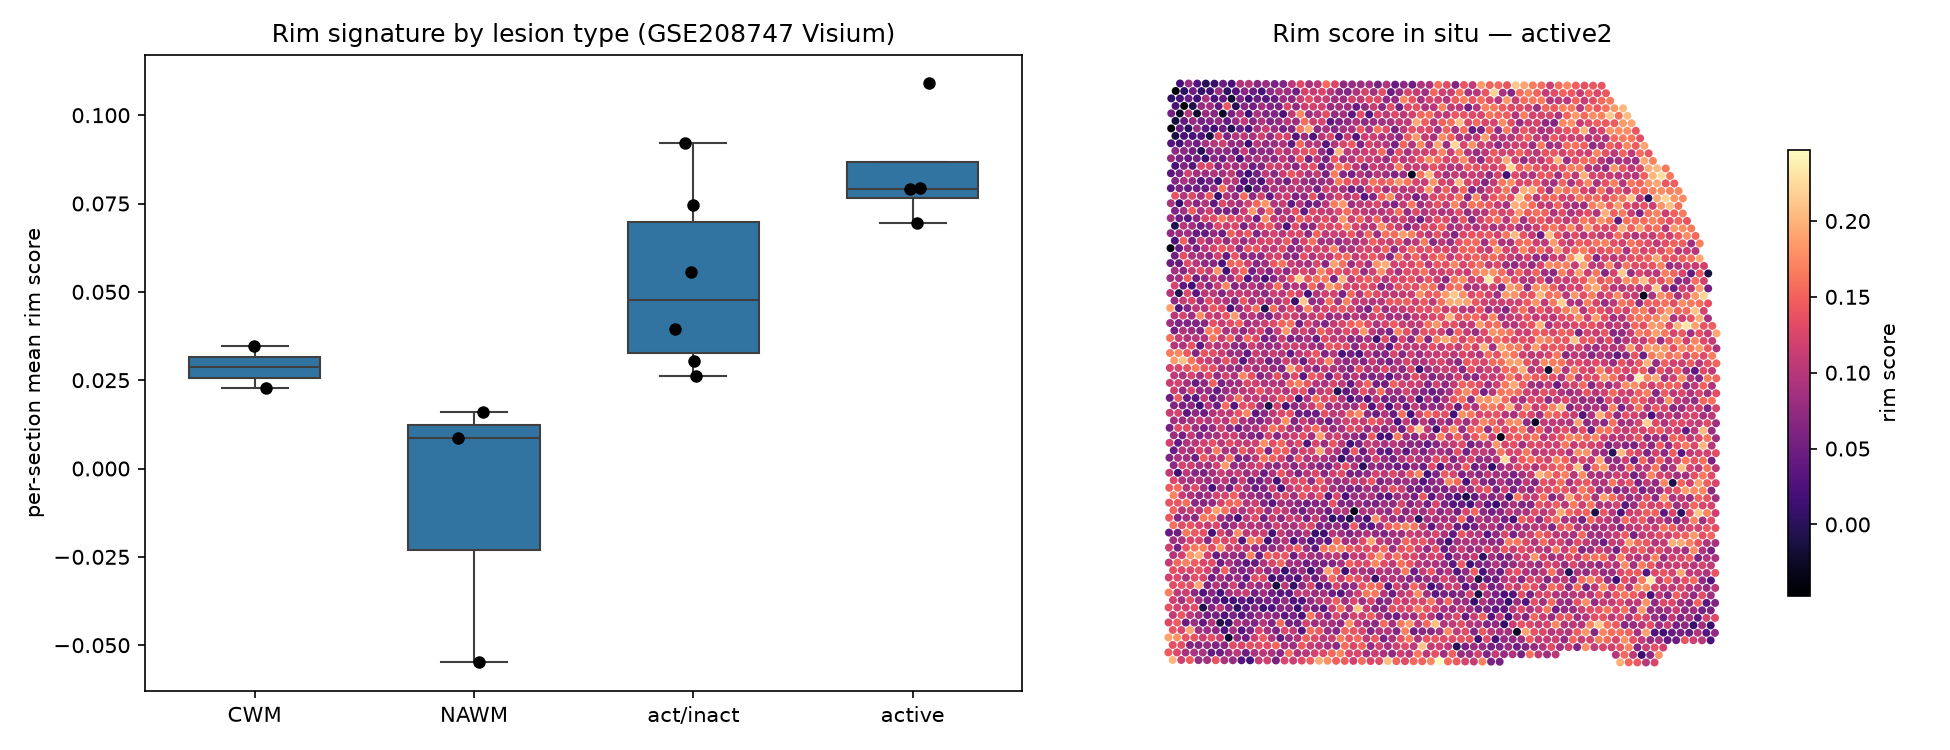
A signature is only interesting if it appears where it should. In whole-transcriptome spatial data (Visium), the signature climbed in a clean gradient: normal white matter < mixed lesions < active lesions.
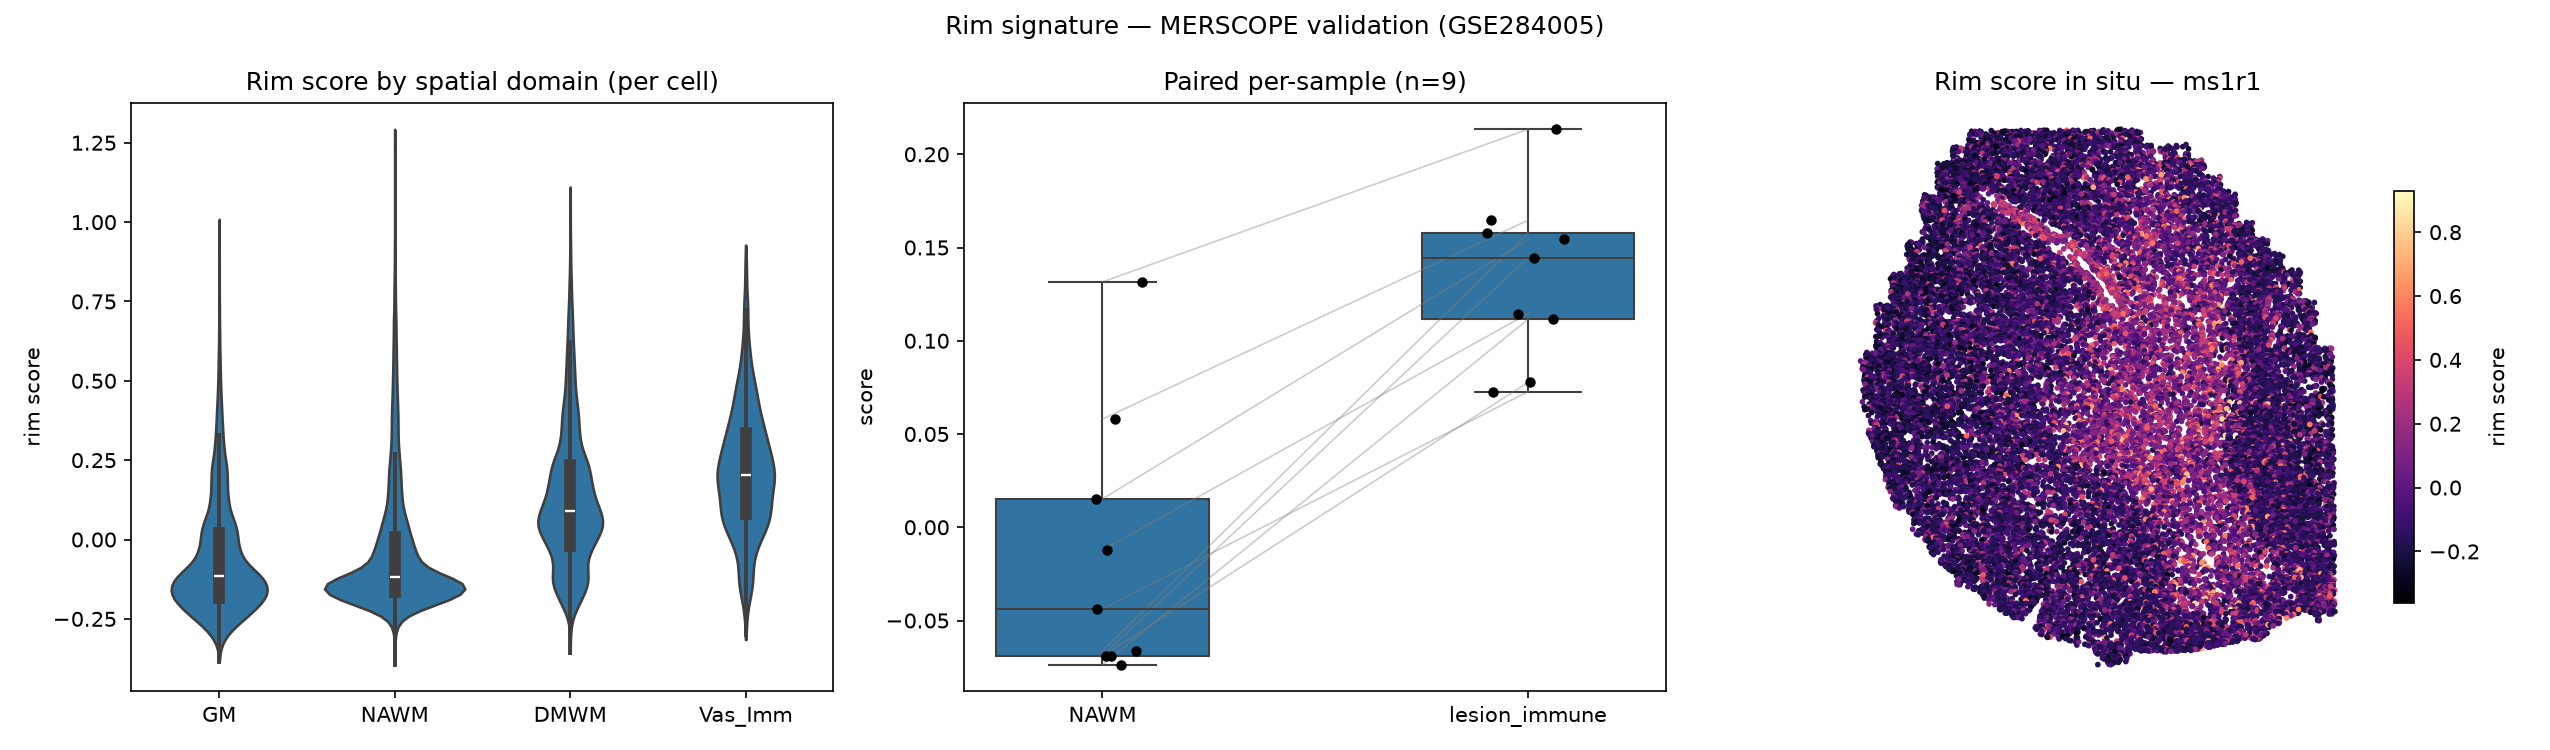
Then, in single-cell-resolution spatial data (MERSCOPE), it did something striking — it traced a bright rim-like structure right through the tissue, and was highest in the vascular-immune niche and the demyelinated lesion, lowest in normal white matter.
Step 3 — the twist: auditing my own result
Here's the part I'm most proud of. Before believing any of it, I audited the pipeline and the statistics adversarially. Three things turned up:
- One “replication” I'd been excited about was invalid — the dataset's “controls” turned out to be the same patients as the disease samples, so I threw that figure out.
- My statistics had treated multiple tissue slices from one donor as independent. Redoing the strongest test properly, at the donor level, the effect held but weakened: the signature is still significantly higher in lesion tissue than normal white matter (p ≈ 0.016 across 6 donors).
- The biggest correction: when I controlled for which cells are present, the rim signal largely disappeared inside each individual cell type. In other words, active lesions score high mostly because they are packed with immune and reactive cells — not because each cell runs a special “rim program.” The honest interpretation is that this signature is a reliable marker of inflammatory infiltration, not (yet) proof of a new cellular mechanism.
What holds up
A signature built entirely from public data reliably distinguishes active, inflamed MS lesion tissue from normal-appearing white matter — reproducibly, across two independent spatial platforms. It's a genuine, if modest, result: the smoldering rim has a readable molecular shadow, dominated by the immune cells that crowd into it. And the exercise is a small case study in doing computational biology honestly: the audit that shrank the claim is exactly what makes the remaining claim trustworthy.
Data & reproducibility
Every panel traces from a public accession through versioned code. Datasets: GSE180759 (discovery, snRNA-seq), GSE208747 (Visium), GSE284005 (MERSCOPE). Methods: Python / Scanpy, pseudobulk differential expression with PyDESeq2, signature scoring, donor-level statistics, and a full self-audit.